Economy
What’s behind the explosive growth in Canadian university costs?

From the Macdonald Laurier Institute
By David Clinton for Inside Policy
Dramatic increases in high-end employment costs have been a significant driver of rising university costs.
We’ve probably all seen reports describing out-of-control higher education costs in the United States. An education that in the 1970s could be financed with some savings and a part-time job at the local Burger King will now cost you the equivalent of a down payment on a multi-family investment property.
Those increases are not just the result of regular inflation. When you track US college costs against consumer goods (as the economist Mark J. Perry did), you’ll see that, besides healthcare, rising college-related expenses are unlike anything else.
What changed? The word on the street is that those crazy tuition costs are mostly due to colleges hiring vast armies of non-teaching administrators.
But what about Canadian universities? Back in 2006–07, according to Statistics Canada, across all Canadian universities the average inflation-adjusted cost of one year’s undergraduate tuition was $17,363. Fast forward to 2023–24 – and that same tuition-only cost has now doubled to $34,628.
Note how I referred to those numbers as “costs.” That’s because $34,628 is what you’ll pay if you’re an international student without scholarships. Thanks to government subsidies, Canadians get a big discount. In fact, the average domestic student currently pays only $6,434. But it’s taxpayers who cover the difference.
So, tuition is rising far faster than inflation. But figuring out what’s behind those increases will take some work.
The rise of the university administrator
As the chart shows, since 2001, teaching jobs have dropped from accounting for 17.38 percent of all university positions down to 14.52 percent in 2022. In other words, universities are, proportionally, hiring teaching staff at significantly lower rates than they used to. But please do keep that “proportional” bit in the back of your mind, as we’ll come back to it later.

Source: Statistics Canada/The Audit
However, those numbers don’t tell us who universities are hiring instead of teaching staff. Perhaps they’re building up their food services, security, and custodial crews?
There is at least one identifiable subgroup that’s visibly ballooned: education support services. That North American Industry Classification System category (NAICS Code 6117) includes educational consultants, student exchange program coordinators, testing services, research and development, guidance counsellors, and tutoring and exam preparation services.
Since 2001, the proportion of support services staff in relation to all hires has more than doubled, from 1.06 percent to 2.62 percent. Their absolute numbers across Canada rose from 3,829 to 15,292. (Statistics Canada offers plenty of data and insights on the topics raised in this article. For further investigation, go here, here, and here).
That’s certainly an interesting trend. But an increase of just 1.5 percent isn’t enough to explain the tuition growth we’ve experienced. And I’m also not sure that the “education support services” category maps directly to the class of high-earning administrator they’re talking about in the US. It looks like we could use some more data.
Tracking Salary Changes in Ontario Universities
The year 1996 saw a welcome victory for government transparency when Ontario’s then-Progressive Conservative Premier Mike Harris mandated the annual disclosure of all public sector employees earning more than $100,000. Since that year, the Sunshine List, as it’s popularly known, has grown from just 4,500 names to more than 300,000. However, $100,000 won’t buy you what it once did – especially if you must live in Toronto.
Perhaps we could bring those numbers up to date. Using the Bank of Canada’s inflation calculator, I identified the inflation-adjusted value of 100,000 1996 dollars for 2003 and for 2023. I then identified the individuals on the list who were employed by universities in 2003 and in 2023 and whose salaries were above the inflation-adjusted thresholds. The new thresholds, by the way, were $117,000 for 2003 and $175,000 in 2023.
The first thing that hits you when you see the adjusted data is the explosive growth in hiring. Ontario universities (not including colleges) employed 2,191 individuals earning more than $117,000 in 2003. Twenty years later, the number of employees earning more than $175,000 had ballooned to 8,536. That’s 290 percent growth. The number of people with “dean” in their job description climbed from 195 to 488 during those years. And there are now 6,772 professors on the high earners’ list as opposed to just 1,782 back in 2003.
For context, Statistics Canada tells us that there were 397,776 students enrolled in Ontario universities in 2003 and 579,057 in 2022 (the latest year for which data is available). That’s an increase of 46 percent – which doesn’t justify the 60 percent jump we’ve seen in high-paid deans and the 74 percent increase in similarly high-paid professors.
I think things are starting to come into focus.
Now let’s find out what happened to salaries. Did you know that there’s a strategic management professor who’s earning more than $650,000 annually? And what about that hybrid dean/lecturer who’s pulling in close to $600,000?
Okay… those are probably outliers, and there isn’t much we can learn from them. However, I can tell you that the average university employee in our Sunshine List earned $140,660 back in 2003. Twenty years later, the inflation-adjusted equivalent of that salary would be $211,887. But in the real world – the one that those on the public payroll graciously agree to share with us – the average 2023 university employee on the list earned $220,404. That’s a difference of only 4 percent or so, but that’s after we already accounted for inflation.
Perhaps I can illustrate this another way. The sum of all university salaries above the $117,000 threshold in 2003 was around $308 million. In 2023 dollars, that would equal $464 million. But the actual sum of all 2023 salaries above $175,000 was $1.8 billion (with a “B”)!
So, yes, tuition has doubled since 2006–07. And it seems that dramatic increases in high-end employment costs have been a significant driver. As the taxpayers paying for most of this, there’s a question that we must ask ourselves: has the epic growth in university employment delivered value to Ontario – and to all Canada – at a scale that justifies those costs? In other words, are the students now graduating from Canadian schools equipped to successfully enter a demanding job market, navigate a fractured political environment, and strengthen weakened communities? Recent scenes from campus protests suggest that might not be the case.
David Clinton is the publisher of The Audit (www.theaudit.ca), a journal of data-driven policy analysis. He is also the author of books on data tools, cloud and Linux administration, and IT security.
This article supplied by Troy Media.
 By Rashid Husain Syed
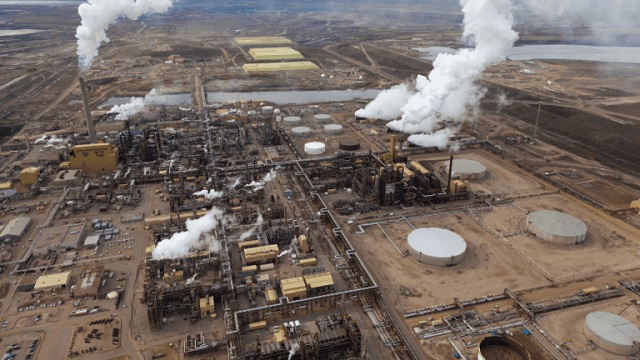
Low-cost oilsands give Canada a crucial edge as U.S. shale oil struggles with rising costs
While global oil markets have rebounded slightly on news of a U.S.-China trade truce, not all producers are equally positioned to benefit. In North America, the contrast is clear: Canada’s oil sector is built for stability, while the U.S. industry is showing signs of strain.
Canada’s oil production is dominated by the oilsands —capital intensive to build, but efficient and low-cost to maintain. Oil sands projects involve mining or steaming oil from sand-rich deposits and can produce for decades, unlike U.S. shale wells that decline rapidly and require constant reinvestment. This gives Canadian producers a structural edge during market downturns.
“The largest companies here in Canada … they have cost structures that are among the best in the world,” said Randy Ollenberger of BMO Capital Markets. “They can withstand WTI (West Texas Intermediate) prices in the range of US$40 and still have enough cash ow to maintain production.”
Mid-sized conventional producers in Canada often break even at US$50 to US$55 per barrel. Major players like Canadian Natural Resources can operate sustainably in the low-to-mid-US$40 range. A break-even price is the minimum oil price needed to cover production costs and avoid operating at a loss.
“We’re not planning on shutting any rigs down or changing our plans, yet,” said Brian Schmidt, CEO of Tamarack Valley Energy. “And it largely is
because our company can tolerate, and is quite profitable, at low prices.” He added: “I think we had already, even before the downturn, put ourselves into a defensive position.”
The data supports that confidence. According to Statistics Canada, 2024 was a record year: crude oil and equivalent output rose 4.3 per cent to 298.8 million cubic metres (about 1.88 billion barrels); exports increased five per cent to 240.4 million cubic metres; and shipments to non-U.S. markets jumped nearly 60 per cent, aided by the completion of the Trans Mountain pipeline expansion.
Nearly 89 per cent of Canada’s oil exports still flow to the United States, but structurally, the two industries are diverging fast.
In the U.S., the shale-driven oil boom is losing steam. Production dropped from a record 13.465 million barrels per day in December 2024 to 13.367 million, according to the U.S. Energy Information Administration.
Industry leaders are warning of a turning point.
“It is likely that U.S. onshore oil production has peaked and will begin to decline this quarter,” said Travis Stice, CEO of Diamondback Energy, the largest independent producer in the Permian Basin. The company is “dropping three rigs and one crew this quarter.”
ConocoPhillips, another major player, is also pulling back. It reduced its capital budget to between US$12.3 billion and US$12.6 billion—down from US$12.9 billion—citing “economic volatility.” Rig counts are falling as well, according to oilfield services company Baker Hughes.
The core challenge is cost. A Federal Reserve Bank of Dallas survey found that Texas producers’ average break-even price is around US$65, the cost to drill replacement wells ranges from US$50 to US$65, and growth drilling requires prices between US$78 and US$85.
Even after the recent rebound—sparked by the May 12 U.S.-China trade truce—West Texas Intermediate sits at around US$63.07, below what many U.S. firms need to expand operations.
Shale’s short life cycles, higher reinvestment demands and rising capital discipline are colliding with lower prices. The U.S. sector is being forced to slow down.
Canada’s oil sector isn’t just surviving—it’s adapting and growing in a volatile market. With lower ongoing costs, long-life assets and increased export flexibility, Canadian producers are proving more resilient than their American peers.
With tens of thousands of jobs across Canada tied to the oilpatch, the sector’s ability to remain profitable through downturns is critical to Canada’s economy, government revenues and energy security.
In a world of unpredictable oil prices, Canada is playing the long game—and winning.
Toronto-based Rashid Husain Syed is a highly regarded analyst specializing in energy and politics, particularly in the Middle East. In addition to his contributions to local and international newspapers, Rashid frequently lends his expertise as a speaker at global conferences. Organizations such as the Department of Energy in Washington and the International Energy Agency in Paris have sought his insights on global energy matters.
Troy Media empowers Canadian community news outlets by providing independent, insightful analysis and commentary. Our mission is to support local media in helping Canadians stay informed and engaged by delivering reliable content that strengthens community connections and deepens understanding across the country.

 MxM News
Quick Hit:
The United States and China have agreed to reduce tariffs for 90 days following trade negotiations in Geneva, offering temporary relief to global markets. The deal marks a pause in the escalating economic conflict, with both countries pledging to resume talks during the truce.
Key Details:
- The U.S. will lower tariffs on Chinese imports from April levels by 24 percentage points, maintaining a 10% base rate.
- China will implement a matching reduction and suspend additional non-tariff measures targeting American goods.
- S&P 500 futures jumped 3%, while U.S. bond yields climbed as investors reacted to signs of de-escalation.
🚨 Treasury Secretary @SecScottBessent announces a major trade deal with China:
“We have reached an agreement on a 90-day pause and substantially move down the tariff levels. Both sides on the reciprocal tariffs will move their tariffs down 115%.” pic.twitter.com/d89RFR3jA4
— Trump War Room (@TrumpWarRoom) May 12, 2025
Diving Deeper:
After weeks of mounting economic tension, the United States and China on Monday jointly announced a 90-day reduction in tariffs, signaling a temporary easing of the trade war that has unnerved businesses, investors, and policymakers across the globe.
The agreement, reached during weekend negotiations in Geneva, was confirmed by U.S. Treasury Secretary Scott Bessent. “We had very robust discussions. Both sides showed great respect to what was a very positive process,” Bessent said in remarks to reporters. According to Bessent, the U.S. will lower its tariffs to 30%, while China will cut its rates to 10% during this period—a proportional rollback from their respective April highs.
The White House clarified that the reduction affects tariffs announced by President Trump on April 2, cutting them by 24 percentage points while keeping the base ad valorem rate of 10%. In response, Beijing agreed not only to match the tariff rollback but also to lift administrative barriers and non-tariff measures it had imposed since April.
Both countries are expected to implement the agreed measures by Wednesday. The joint statement released following the talks indicated that discussions will continue over the coming months as the two sides explore a longer-term resolution.
Markets reacted quickly and positively. S&P 500 futures surged over 3% on the news, providing a shot of optimism after weeks of uncertainty. The U.S. Dollar Index, which had been under pressure due to investor anxiety about America’s trade posture, rose more than 1%. Meanwhile, bond markets adjusted sharply, with the yield on the 10-year Treasury climbing to 4.445%, its highest point since early April.
While the 90-day pause offers breathing room, the underlying issues remain unresolved. Businesses that had delayed orders due to tariff costs may now rush to restock, a move that could cause short-term volatility or even a demand shock in some sectors. Economists warn that without a longer-term agreement, the reprieve may prove fleeting.
For now, though, the breakthrough offers a glimmer of hope. It’s a notable win for President Trump’s strategy of tough negotiations, underscoring his administration’s commitment to putting American interests first while forcing adversaries to the table. The outcome stands in stark contrast to the previous administration’s conciliatory tone and may reinforce the argument for a more assertive U.S. economic posture on the world stage.


Premier Smith seeks Alberta Accord: Announces new relationship with Ottawa
It’s time to get excited about the great Canadian LNG opportunity

Ice Surprises – Arctic and Antarctic Ice Sheets Are Stabilizing and Growing
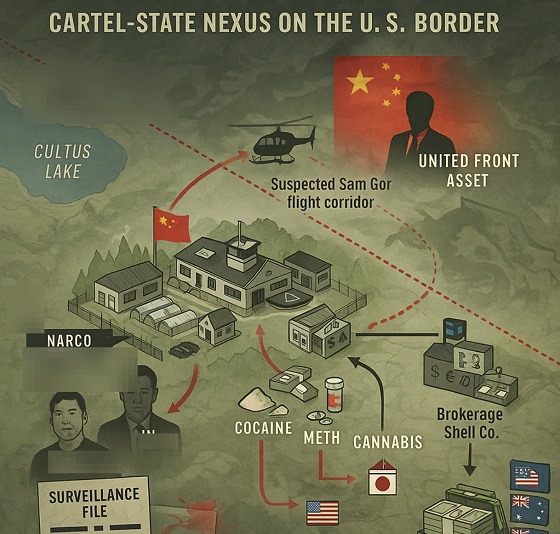
Inside B.C.’s Cultus Lake Narco Corridor — How Chinese State-Linked Syndicates are Building a Narco Empire in Canada
-
Alberta1 day ago
Premier Smith seeks Alberta Accord: Announces new relationship with Ottawa
-
Energy1 day ago
It’s time to get excited about the great Canadian LNG opportunity
-
International1 day ago
Ice Surprises – Arctic and Antarctic Ice Sheets Are Stabilizing and Growing
-
Crime1 day ago
Inside B.C.’s Cultus Lake Narco Corridor — How Chinese State-Linked Syndicates are Building a Narco Empire in Canada
-
 Energy1 day ago
Is the Carney Government Prepared to Negotiate a Fair Deal for the Oil, Gas and Pipeline Sectors
-
 Alberta1 day ago
Energy projects occupy less than three per cent of Alberta’s oil sands region, report says
-
 Health1 day ago
Jay Bhattacharya Closes NIH’s Last Beagle Lab
-
 Daily Caller1 day ago
Misguided Climate Policies Create ‘Real Energy Emergency’ And Permit China To Dominate US